
Showing posts with label Aqueous Solutions. Show all posts
Showing posts with label Aqueous Solutions. Show all posts
Thursday, January 14, 2016
Solutions Stoichiometry
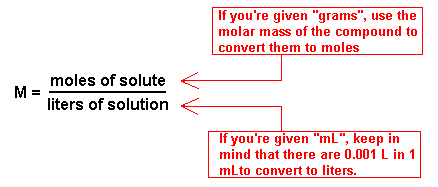
When calculating molarity, stoichiometry can also be used. There are steps to follow when using stoichiometry, one is systematic approach, and the other is the flow chart, which is shown below. This topic can be hard to grasp, so using these links can be helpful.


Thursday, January 7, 2016
Dilutions and Lab
Today in class we completed an aqueous solution lab. We performed this lab to see how the concentrations of the solutions change in a serial dilution. We began the lab with 20 drops of food coloring in 10 mL of water. For the next solution we took 1.0 mL of the previous solution and added it to 9 mL of water. We continued this until the food coloring was no longer visible.


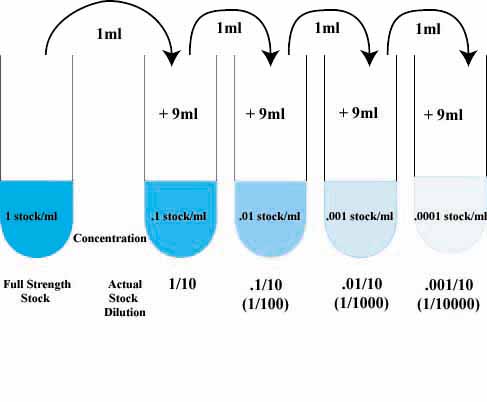
This link has practice problems for serial dilutions, and this website and second website explains the topic more in depth.
Wednesday, January 6, 2016
Tuesday, January 5, 2016
Solubility Curves
Solutions are made up of two parts the solute and the solvent. The solute is what is dissolved in the solvent. The solvent is part of the solution that is in the largest quantity.


There is a limit on how much solute can be dissolved in the solvent. There are three stages of how much solute can be dissolved in a solvent: unsaturated, saturated, and supersaturated. The graph below is a solubility curve this shows what compound is unsaturated, saturated, and supersaturated.
This link shows you how to read a solubility curve and gives you some practice reading them.
This link shows you how to read a solubility curve and gives you some practice reading them.
Subscribe to:
Posts (Atom)